Tau for MPI Tracing
This guide shows how to use the TAU Performance System to trace an MPI-based C++ application on the Mahuika HPC cluster.
Tracing records a time-ordered sequence of events during program execution. Each event is timestamped and written to a trace file so that the exact runtime behaviour of the program can be reconstructed. Events may include entry and exit of functions, MPI communication calls and synchronization events (barriers, waits).
Tracing is particularly useful for identifying load imbalance, communication bottlenecks and idle time in applications.
The example uses the fidibench benchmark and its upwindMpiCxx executable.
The workflow consists of four steps:
- Build TAU for the desired compiler toolchain
- Build your application
- Inspect the results with TAU analysis tools
Prerequisites
Load the required modules for the compiler toolchain and MPI. TAU should be compiled against the same compiler and MPI toolchain that will be used to build and run the application. Here we use gimkl/2022a, adapt as required.
module purge
module load gimkl/2022a CMake
Confirm the versions:
g++ --version
mpicxx --version
cmake --version
1. Build TAU on Mahuika
The instructions have been tested for
TAU_VERSION=2.35.1
PDT_VERSION=3.25.2
Download and build its dependencies:
wget http://tau.uoregon.edu/tau.tgz
tar xf tau.tgz
cd tau-${TAU_VERSION}
wget http://tau.uoregon.edu/ext.tgz
tar xf ext.tgz
wget http://tau.uoregon.edu/pdt_lite.tar.gz
tar xf pdt_lite.tar.gz
cd pdtoolkit-${PDT_VERSION}
./configure
make && make install
cd ..
TAU_HOME, the location where you want TAU to be installed (change!), e.g.:
export TAU_HOME=/nesi/project/nesi99999/$USER/tau
Configure TAU for MPI and OpenMP (check the TAU documentation for CUDA support):
./configure \
  -mpi -ompt \
  -pdt=$PWD/pdtoolkit-${PDT_VERSION} \
  -bfd=download -dwarf=download -unwind=download -iowrapper \
  -otf=download \
  -prefix=$TAU_HOME
make install
Add TAU to your environment and check the tau_exec can be found:
export PATH=$TAU_HOME/x86_64/bin:$PATH
which tau_exec
TAU_MAKEFILE to it:
ls $TAU_HOME/x86_64/lib/Makefile.tau-ompt-mpi-pdt-openmp
export TAU_MAKEFILE=$TAU_HOME/x86_64/lib/Makefile.tau-ompt-mpi-pdt-openmp
2. Obtain the example code (fidibench) and compile it
git clone https://github.com/pletzer/fidibench.git
cd fidibench
mkdir build
cd build
cmake -DCMAKE_BUILD_TYPE=RelWithDebInfo ..
make
3. Run the application and analyse the results
Run with tau_exec in front of the executable after setting TAU_TRACE=1:
export TAU_TRACE=1
export TAU_PROFILE=0
export TRACEDIR=traces
mkdir -p $TRACEDIR
srun --ntasks=32 tau_exec ./upwind/cxx/upwindMpiCxx -numCells 512 -numSteps 5
cd $TRACEDIR
rm -f tau.trc tau.edf
tau_treemerge.pl
tau2slog2 tau.trc tau.edf -o upwindMpiCxx.slog2
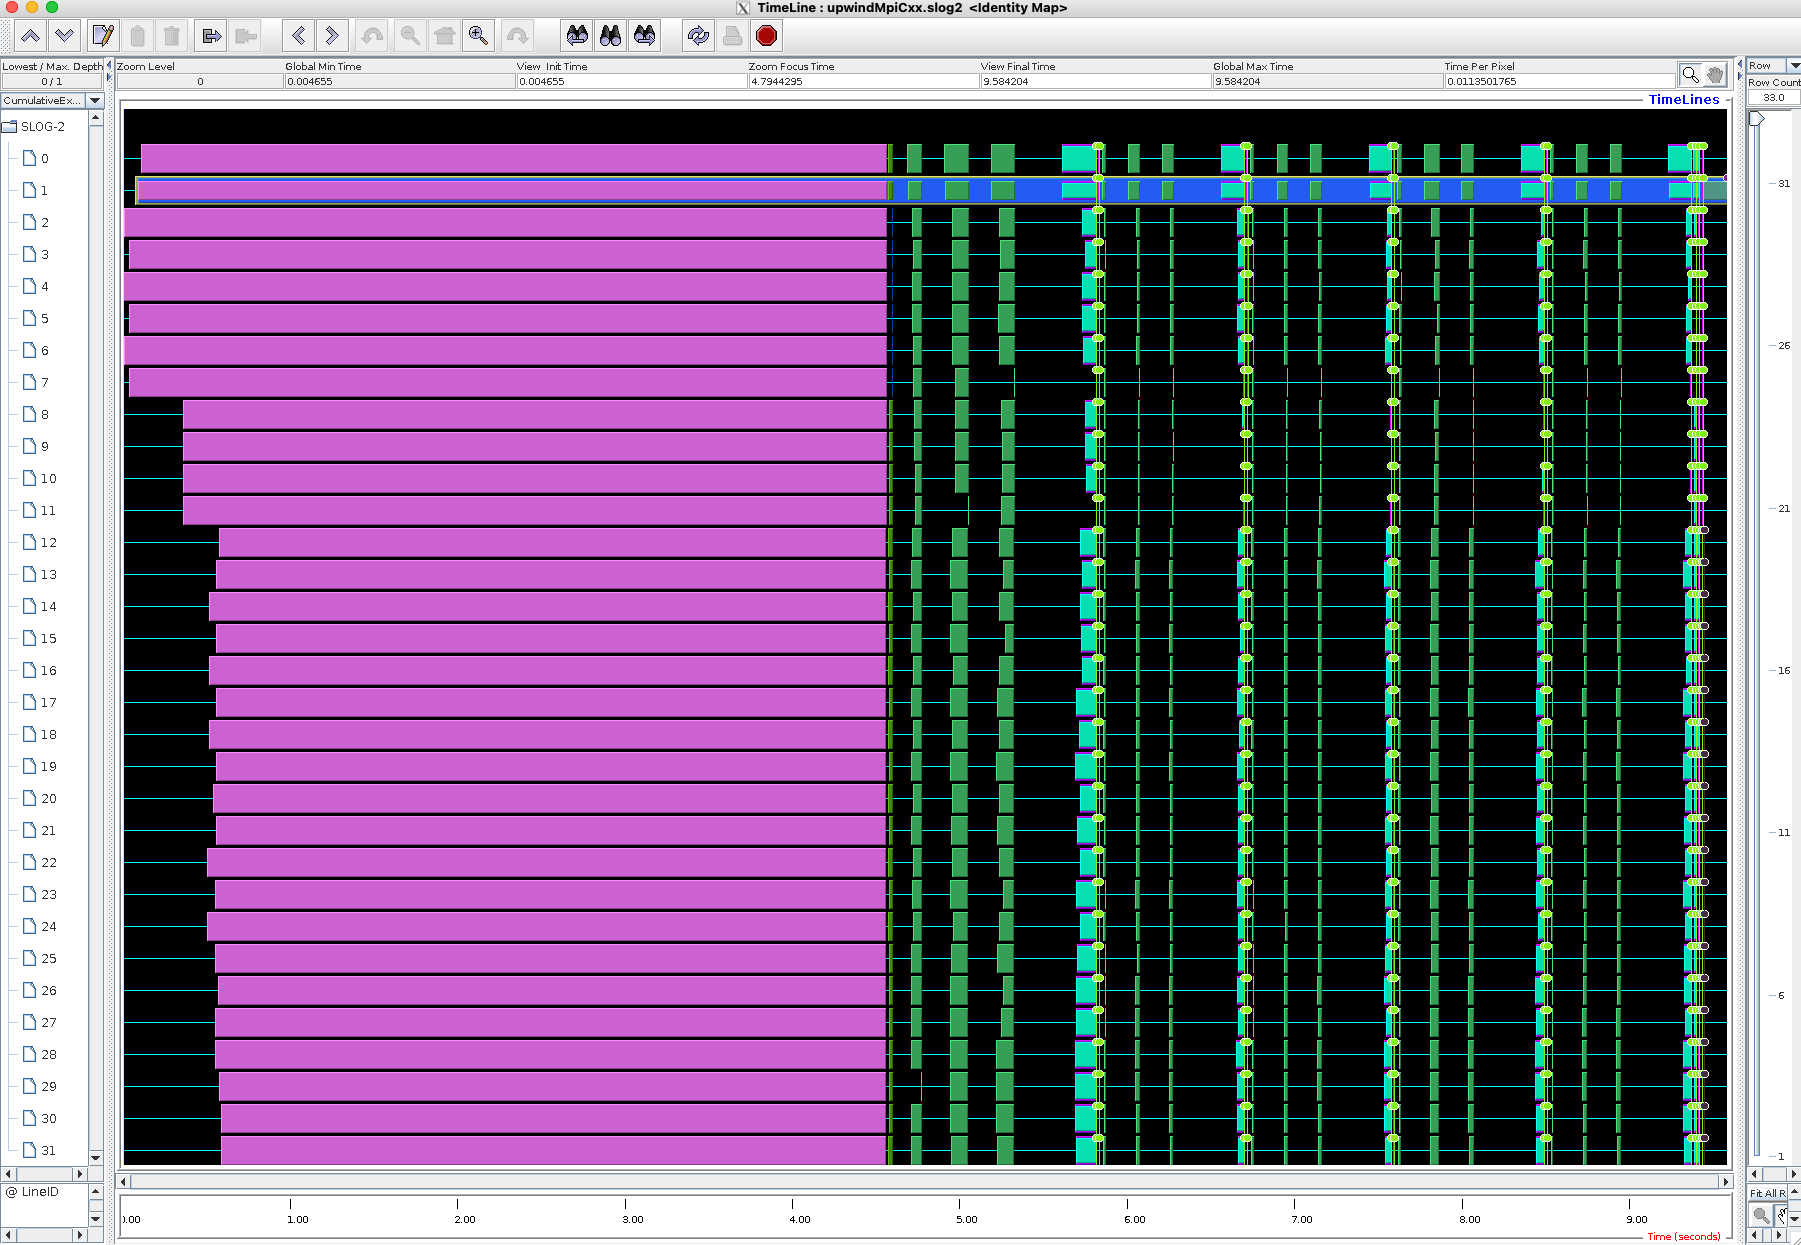
jumpshot upwindMpiCxx.slog2
jumpshot application and its jumpshot.jar file can be copied to another platform to view the traces. For maximum interactivity, we
recommend to copy the slog2 file to your local computer and run jumpshot there.
Mac Users
If you are connecting from a Mac you may need to invoke
jumpshot -fix-xquartz upwindMpiCxx.slog2